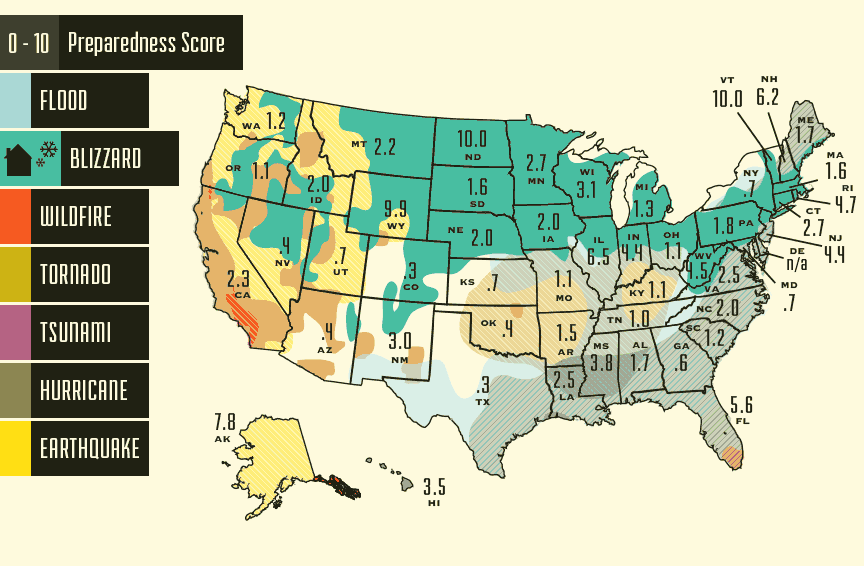
Among preppers, there is an endless debate as to what parts of the country would be safest to live in should the SHTF. You have to factor in statistics like population density, politics, poverty levels, natural resources, and how prone the area is to natural disasters. No state is perfect, but you can reasonably determine that certain places would be significantly safer than others.
However, most survivalists don’t factor in the preparedness level of their state government. By their nature, they’ve long abandoned the notion that you can trust the authorities to save your butt when society falls apart.
This certainly isn’t without just cause, but I think government preparedness deserves a second look. After all, if the government is at least somewhat prepared to take care of the population during a disaster, than preppers in that state will have less to worry about from other survivors.
Recently foodstorage.com, a survival food vendor, created a map that determines how safe and prepared each state is. It goes over the most common natural disasters, and their likelihood of occurring in each state. They then established how much money each state spends on preparedness per capita, and gave a score between 0 and 10 for both categories.

If you take a look at the website, you’ll find that they coupled those two numbers and created a list that ranks each state in order from the most, to the least resilient. Some of the results aren’t too surprising. As many preppers have known for a long time, places with very high population densities tend to be poorly prepared.
California, Texas, and New York, the states with the highest populations, are all ranked within the bottom five. The only population dense state that spent a lot of money on preparedness was Illinois. These three states have the highest likelihood of being struck by a disaster, and yet they spend the least amount of money on safety and preparedness, with Texas scoring the worst overall.
Though in all fairness to Texas, almost all of the southern conservative states scored poorly. I suspect this may be due to the fact that their populations tend to be more self reliant and prepared in general, so their state governments don’t feel the need to spend as much on preparedness.
In the Northeast, it appears to be quite random, with some states spending a lot, and some like New York spending very little. What surprised me was Vermont, which alongside North Dakota ended up spending the most money per capita on disaster preparedness. I can only guess as to why this may be. These statistics also answered a question that many preppers have been debating for years. Which state is the least prone to natural disasters?
Wyoming apparently. They also spend quite a bit on disaster preparedness, just behind Vermont and North Dakota, making them the most resilient state in America. However one fact still remains. No matter how well prepared your state is, it is always prudent to stock up on your own supplies, should disaster strike. No amount of tax dollars can guarantee your safety when the SHTF.

Before I moved to Louisiana, I was driving through on my way to Texas after Katrina. I saw hot dog stands and yard sales in parking lots; it seemed almost like a carnival of effort at self sufficiency. I was so impressed, and I see we got a bad score.
;